Data Visualization in Browser
Ville Voutilainen
2019-11-14
Views expressed are those of the presenter.
Built using reveal.js. Tested to work in Chrome.
In this presentation
- Quick motivation for data visualization.
- Basics of creating visualizations in a web browser.
- Hands-on example.
About me
Interested in promoting dataviz within finance. See my web page for more!
Why dataviz?
Vision is the strongest human sense
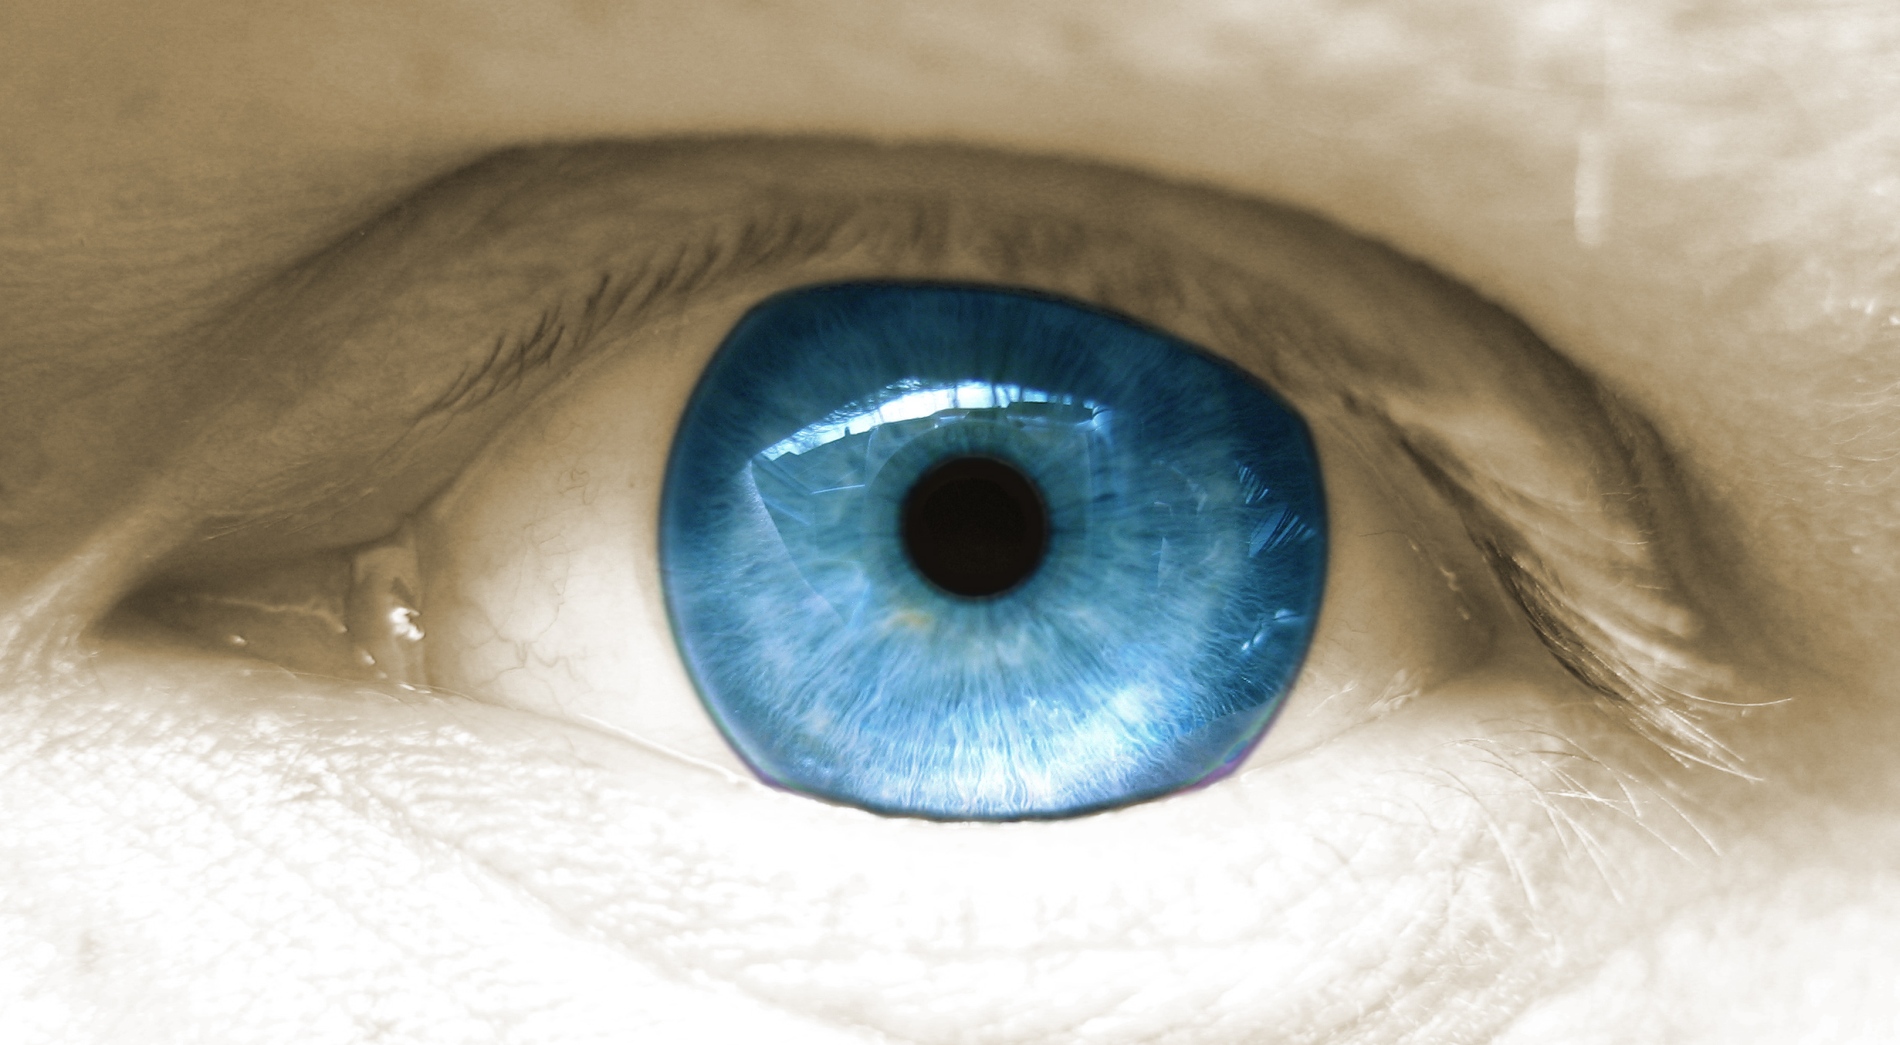
FreeImages.com/Henrik L.
>Advantages of dataviz
- In many cases visualizations are the most effective way to convey information.
- May reveal features that otherwise remain hidden.
- Often more approachable than tables and equations.
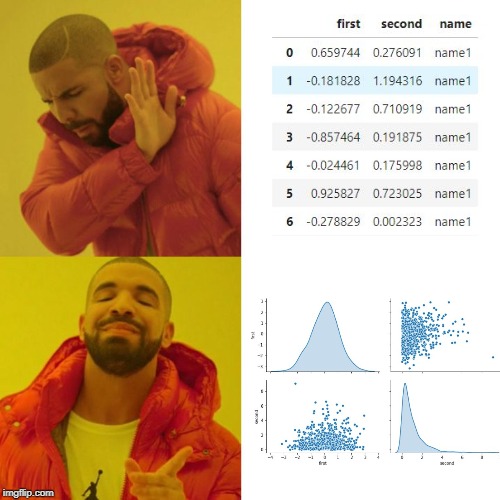
Created using imgflip.com.
“We should think of data visualization not only as a way to present findings but also as a tool that helps us think.”
Great place to learn more
Dataviz in browser
The idea is to harness browser for presenting data. It involves binding data to the Document Object Model (DOM) that describes the browser window.
This will be done with
One does not have to become a full-fledged web developer, but (in addition to JS) some
Trinity of web dev
What do we need to get started?
- Good
editor (e.g. VSCode). - Modern
web browser (e.g. Chrome).Not Explorer ! - JS dependencies, e.g.
d3 (others: Vega, Highcharts,...). - Optional: web server (e.g. simple localhost server).
- Helpful: Basics understanding of HTTP.
- Helpful: Basics of Scalable Vector Graphics (SVG) and/or HTML canvases.
Hands-on primer: D3 Tips and Tricks v4.x.
Simple example
Let's build an example where we...
... construct a web page from scratch...
... with an svg...
... which has a circle drawn on it...
... that has special styling...
... and moves when clicked!
Code here.
HTML page skeleton
							<!DOCTYPE html>
							<html>
							   <head>
							   <!-- Header of page: meta info, external imports. -->
							   </head>

							   <style>
							   <!-- Page styling: CSS goes in here! -->
							   </style>

							   <body>
							   <!-- Body of page: HTML or JS go in here! -->
							   </body>
							</html>
Pretty neat, huh?!
Thank you!
References
- Data visualization handbook (Koponen & Hildén 2019).
- D3 Tips and Tricks v4.x (Malcom Maclean 2018).
- The Visual Display of Quantitative Information (Edward Tufte 1983).