Prelude to Data Analytics
* Views expressed are those of the presenter.
Presentation tested to work in Chrome.
In this presentation
- My definition of
Data Analytics and related terms. - Diving into a few special cases:
Predictive Modelling andData Visualization .
Some good references
- Carmichael and Marron (2018): Data science vs. statistics: two cultures?
- Donoho (2017): 50 years of Data Science
"A data scientist is a statistician who lives in San Francisco" pic.twitter.com/NAftOI9jmJ via @smc90
— Chris Dixon (@cdixon) January 30, 2014
Definition of Data Science
“To a general audience, data science is often defined as the intersection of three areas: maths/statistics, computation and a particular domain.”
Carmichael and Marron (2018)
We define it as combination of six areas of
6 areas of Greater Data Science
- Data gathering, preparation, and exploration.
- Data representation and transformation.
- Computing with data.
- Data modelling.
- Data visualization and presentation.
- Science about data science.
Definition of Data Analytics
“Analytics is the discovery, interpretation, and communication of meaningful patterns in data and applying those patterns towards effective decision making. In other words, analytics can be understood as the connective tissue between data and effective decision making, within an organization.”
Data Analytics Road Map

My favorite toolkit
Let's focus on two subfields
Predictive modelling Data visualization
...so thet we don't end up like this
This Harvard Business Review chart seems to have been made by someone who didn't know what most of the terms meant: https://t.co/QA3jv0tBWN pic.twitter.com/a6MZyeFfpO
— Stuart Buck (@StuartBuck1) October 22, 2018
Visual introduction to predictive modelling
If one insists on throwing "machine learning" in there...
I've started mentally replacing "AI", "Neural Network", and other buzz terms with "Predictive model". It removes a false sense of agency, better reflects reality, and instantly brings the hype factor down by 300%.
— Jesse Engel (@jesseengel) October 12, 2018
Data visualization
“We should think of data visualization not only as a way to present findings but also as a tool that helps us think.”
- Anonymous
Greetings from the land of dataviz!
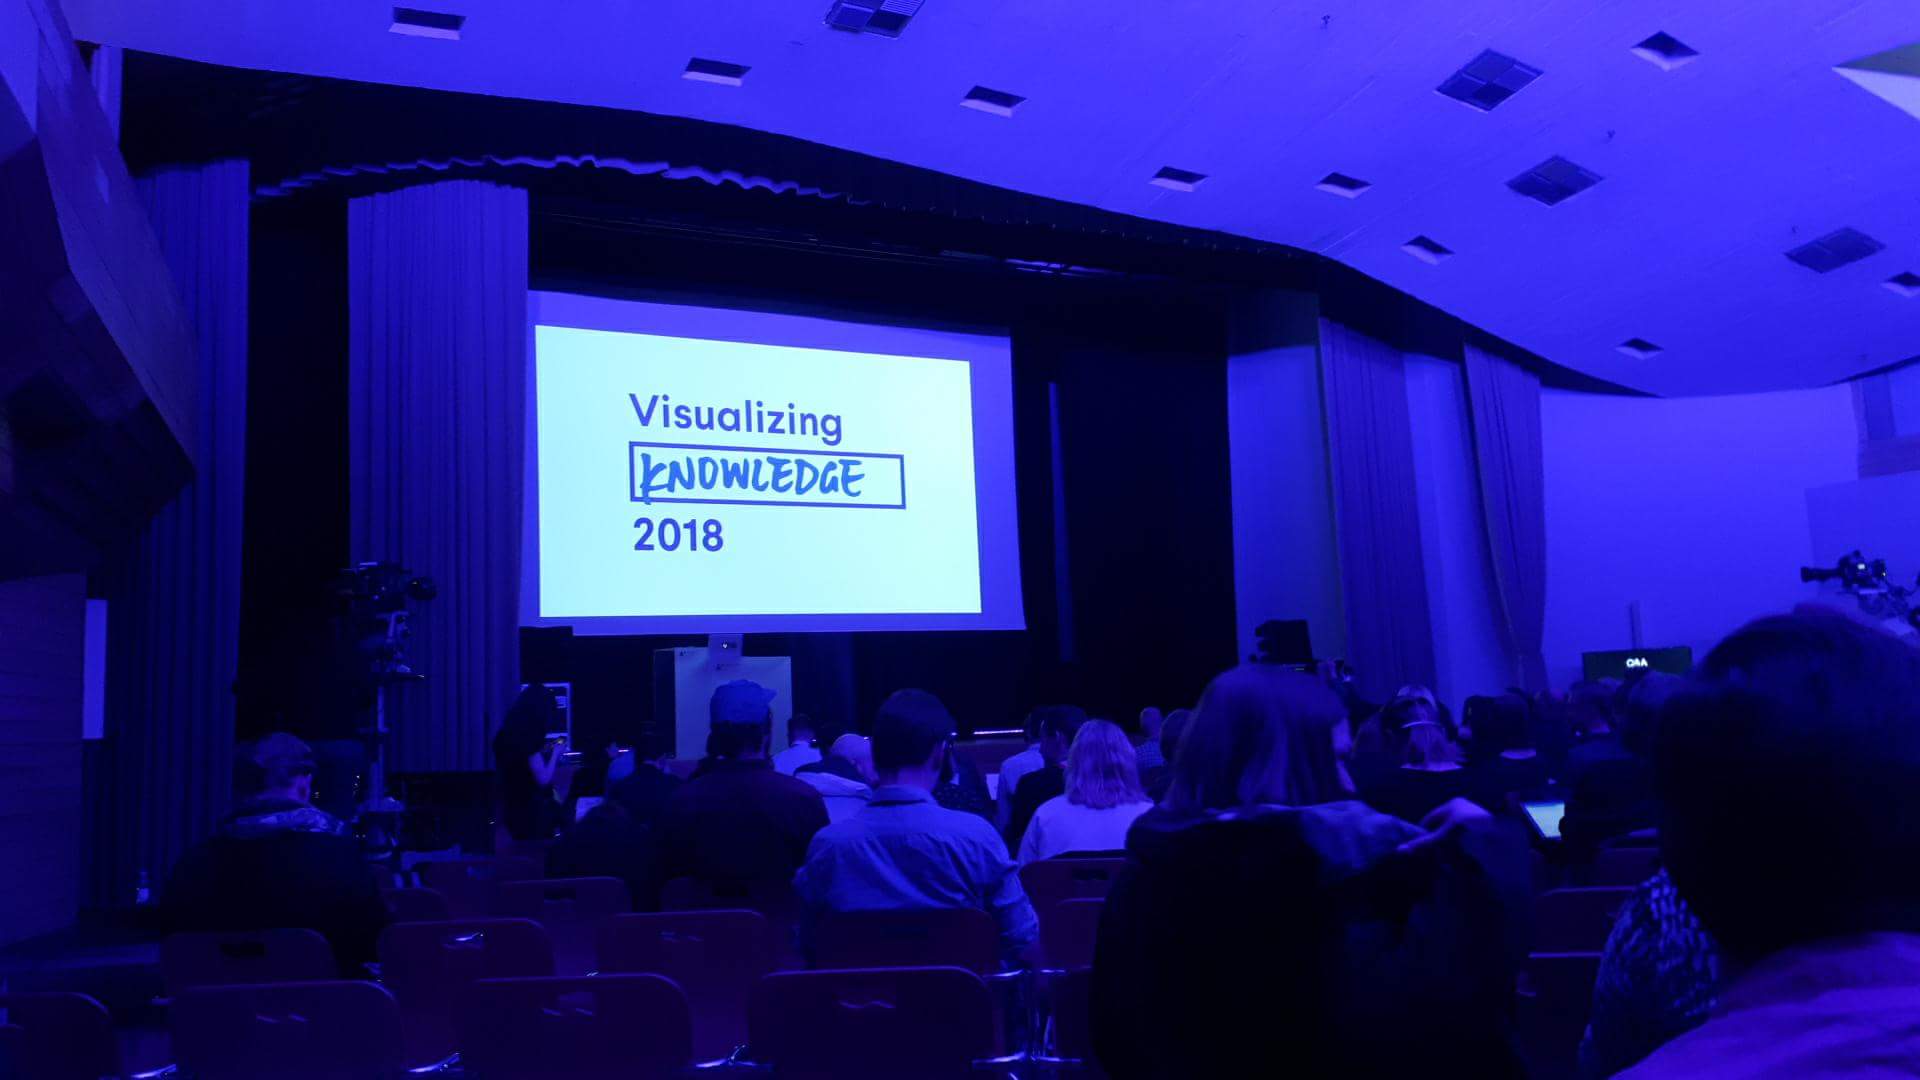
- Visualizing Knowledge Helsinki 2018
Dataviz is becoming essential part of scientific research
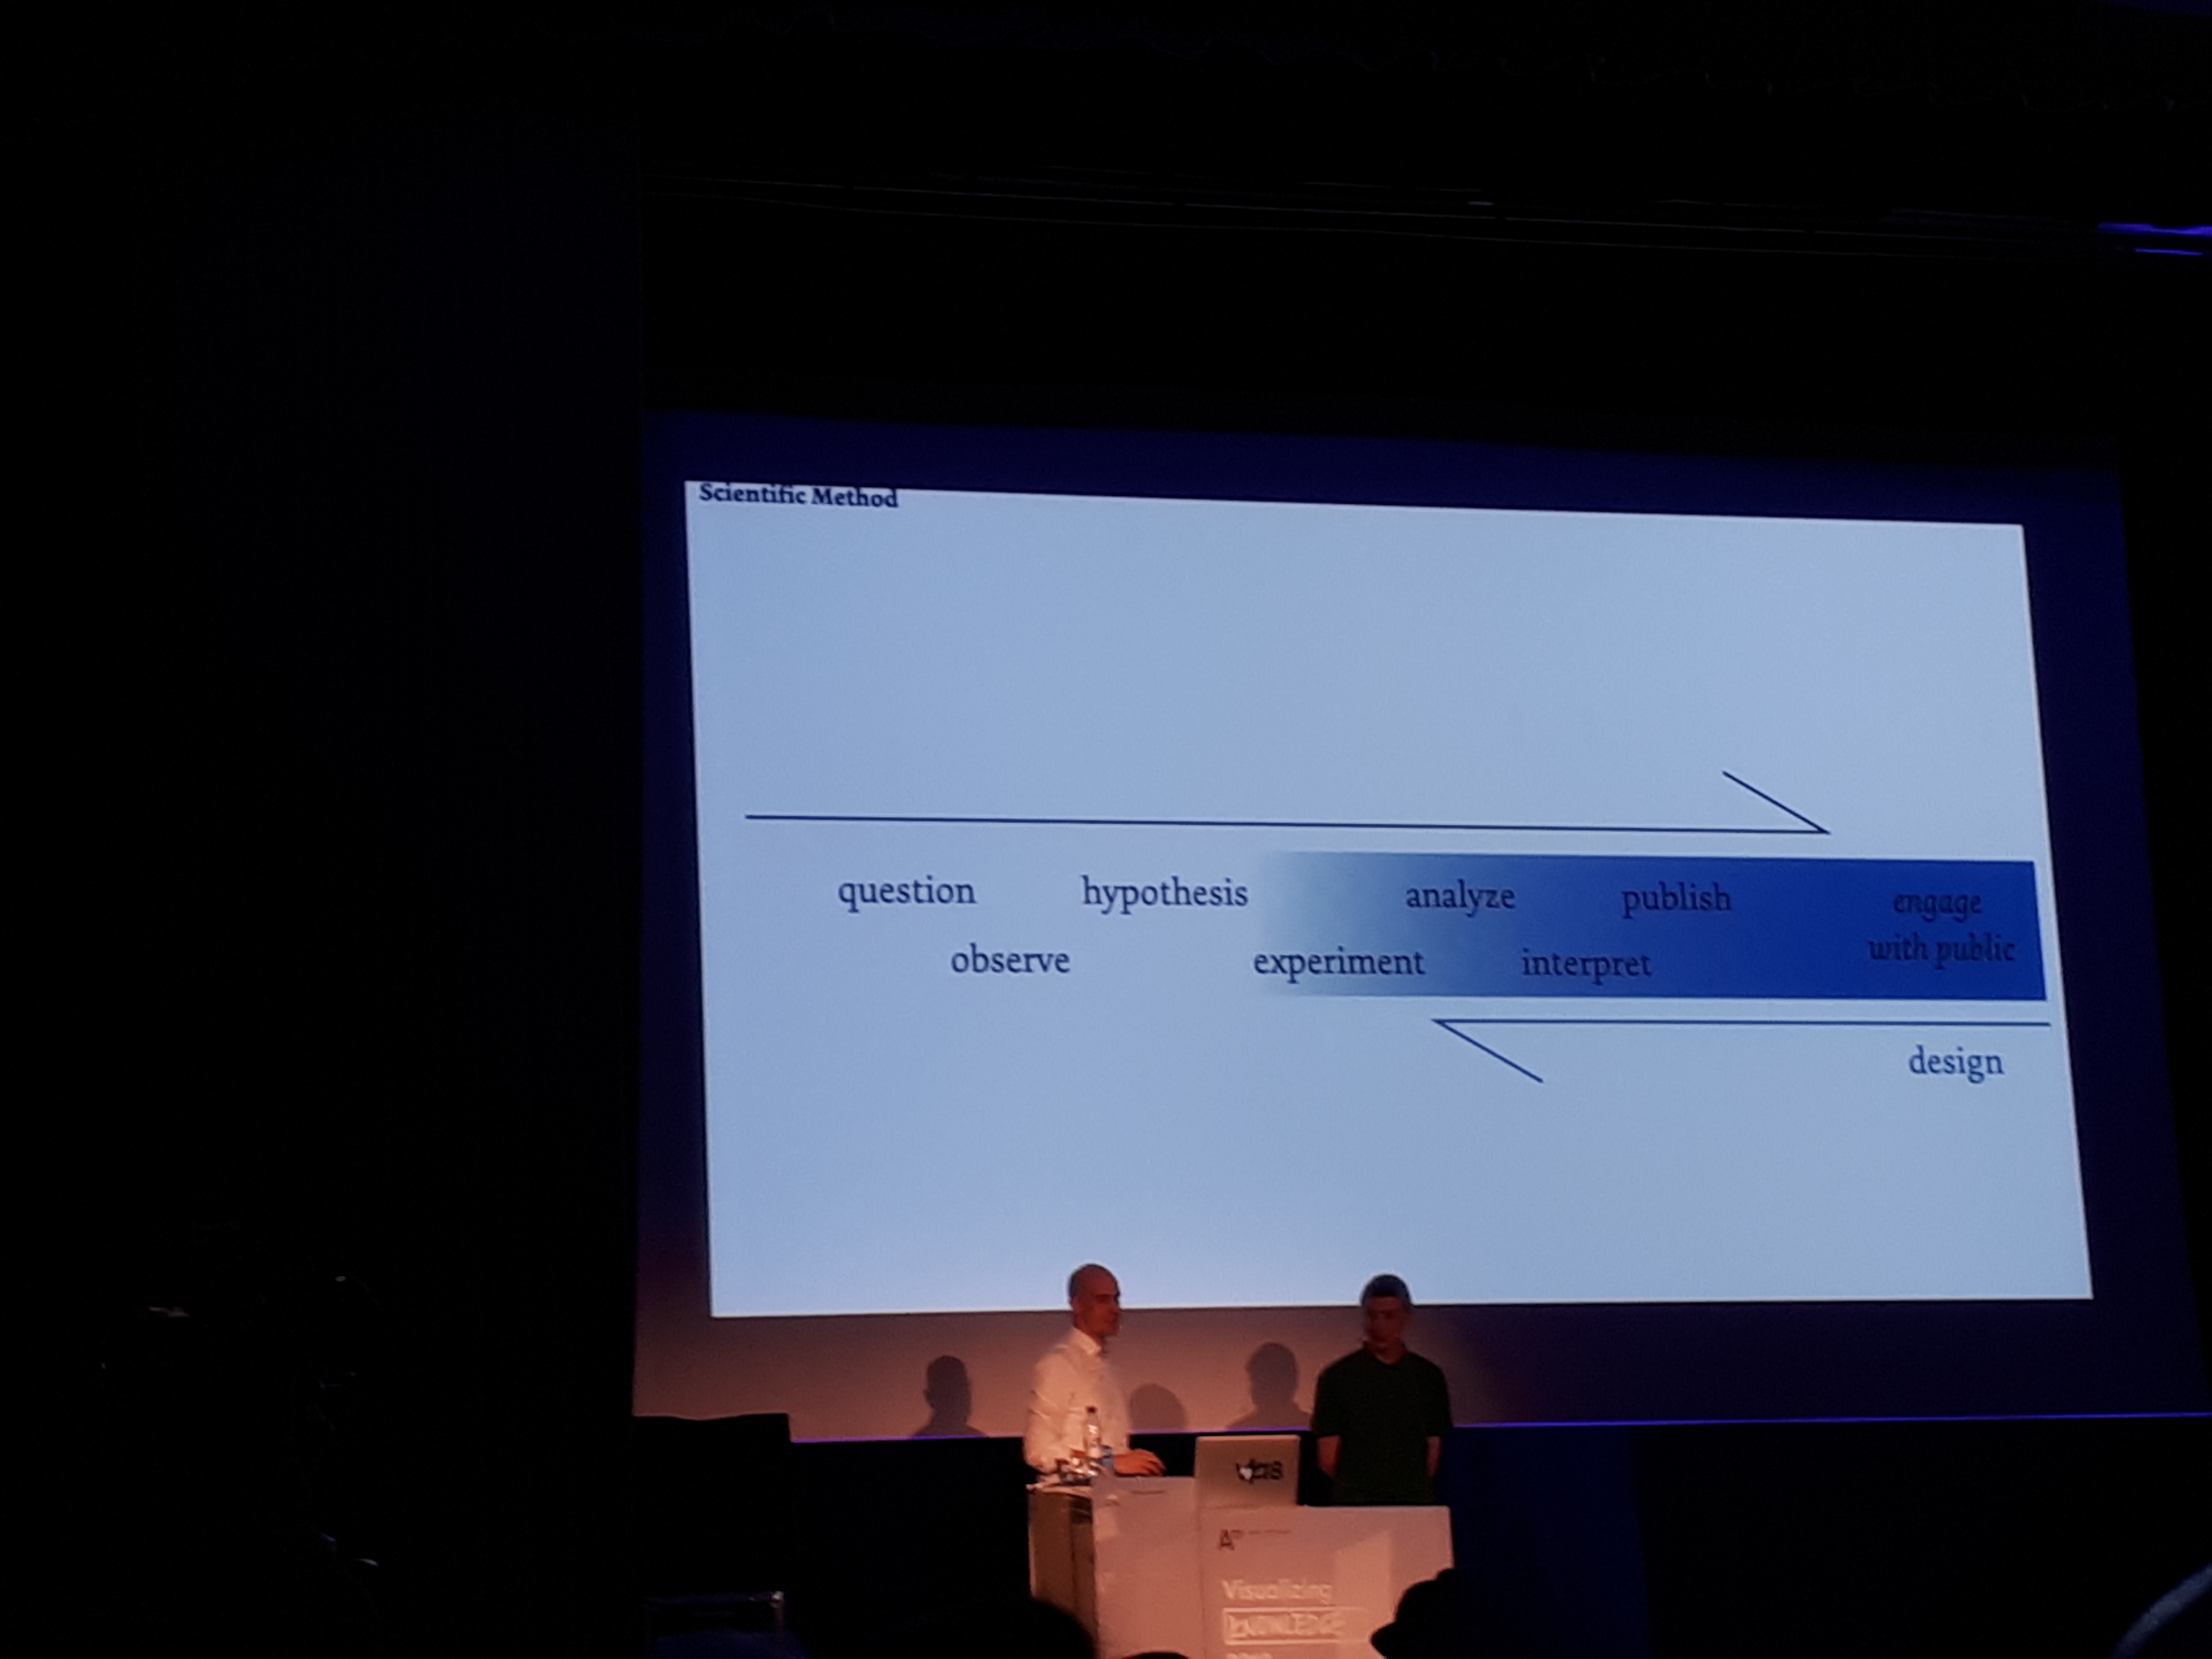
Fidel Thomet and Boris Müller, Urban Complexity Lab
Example of what it should not be...
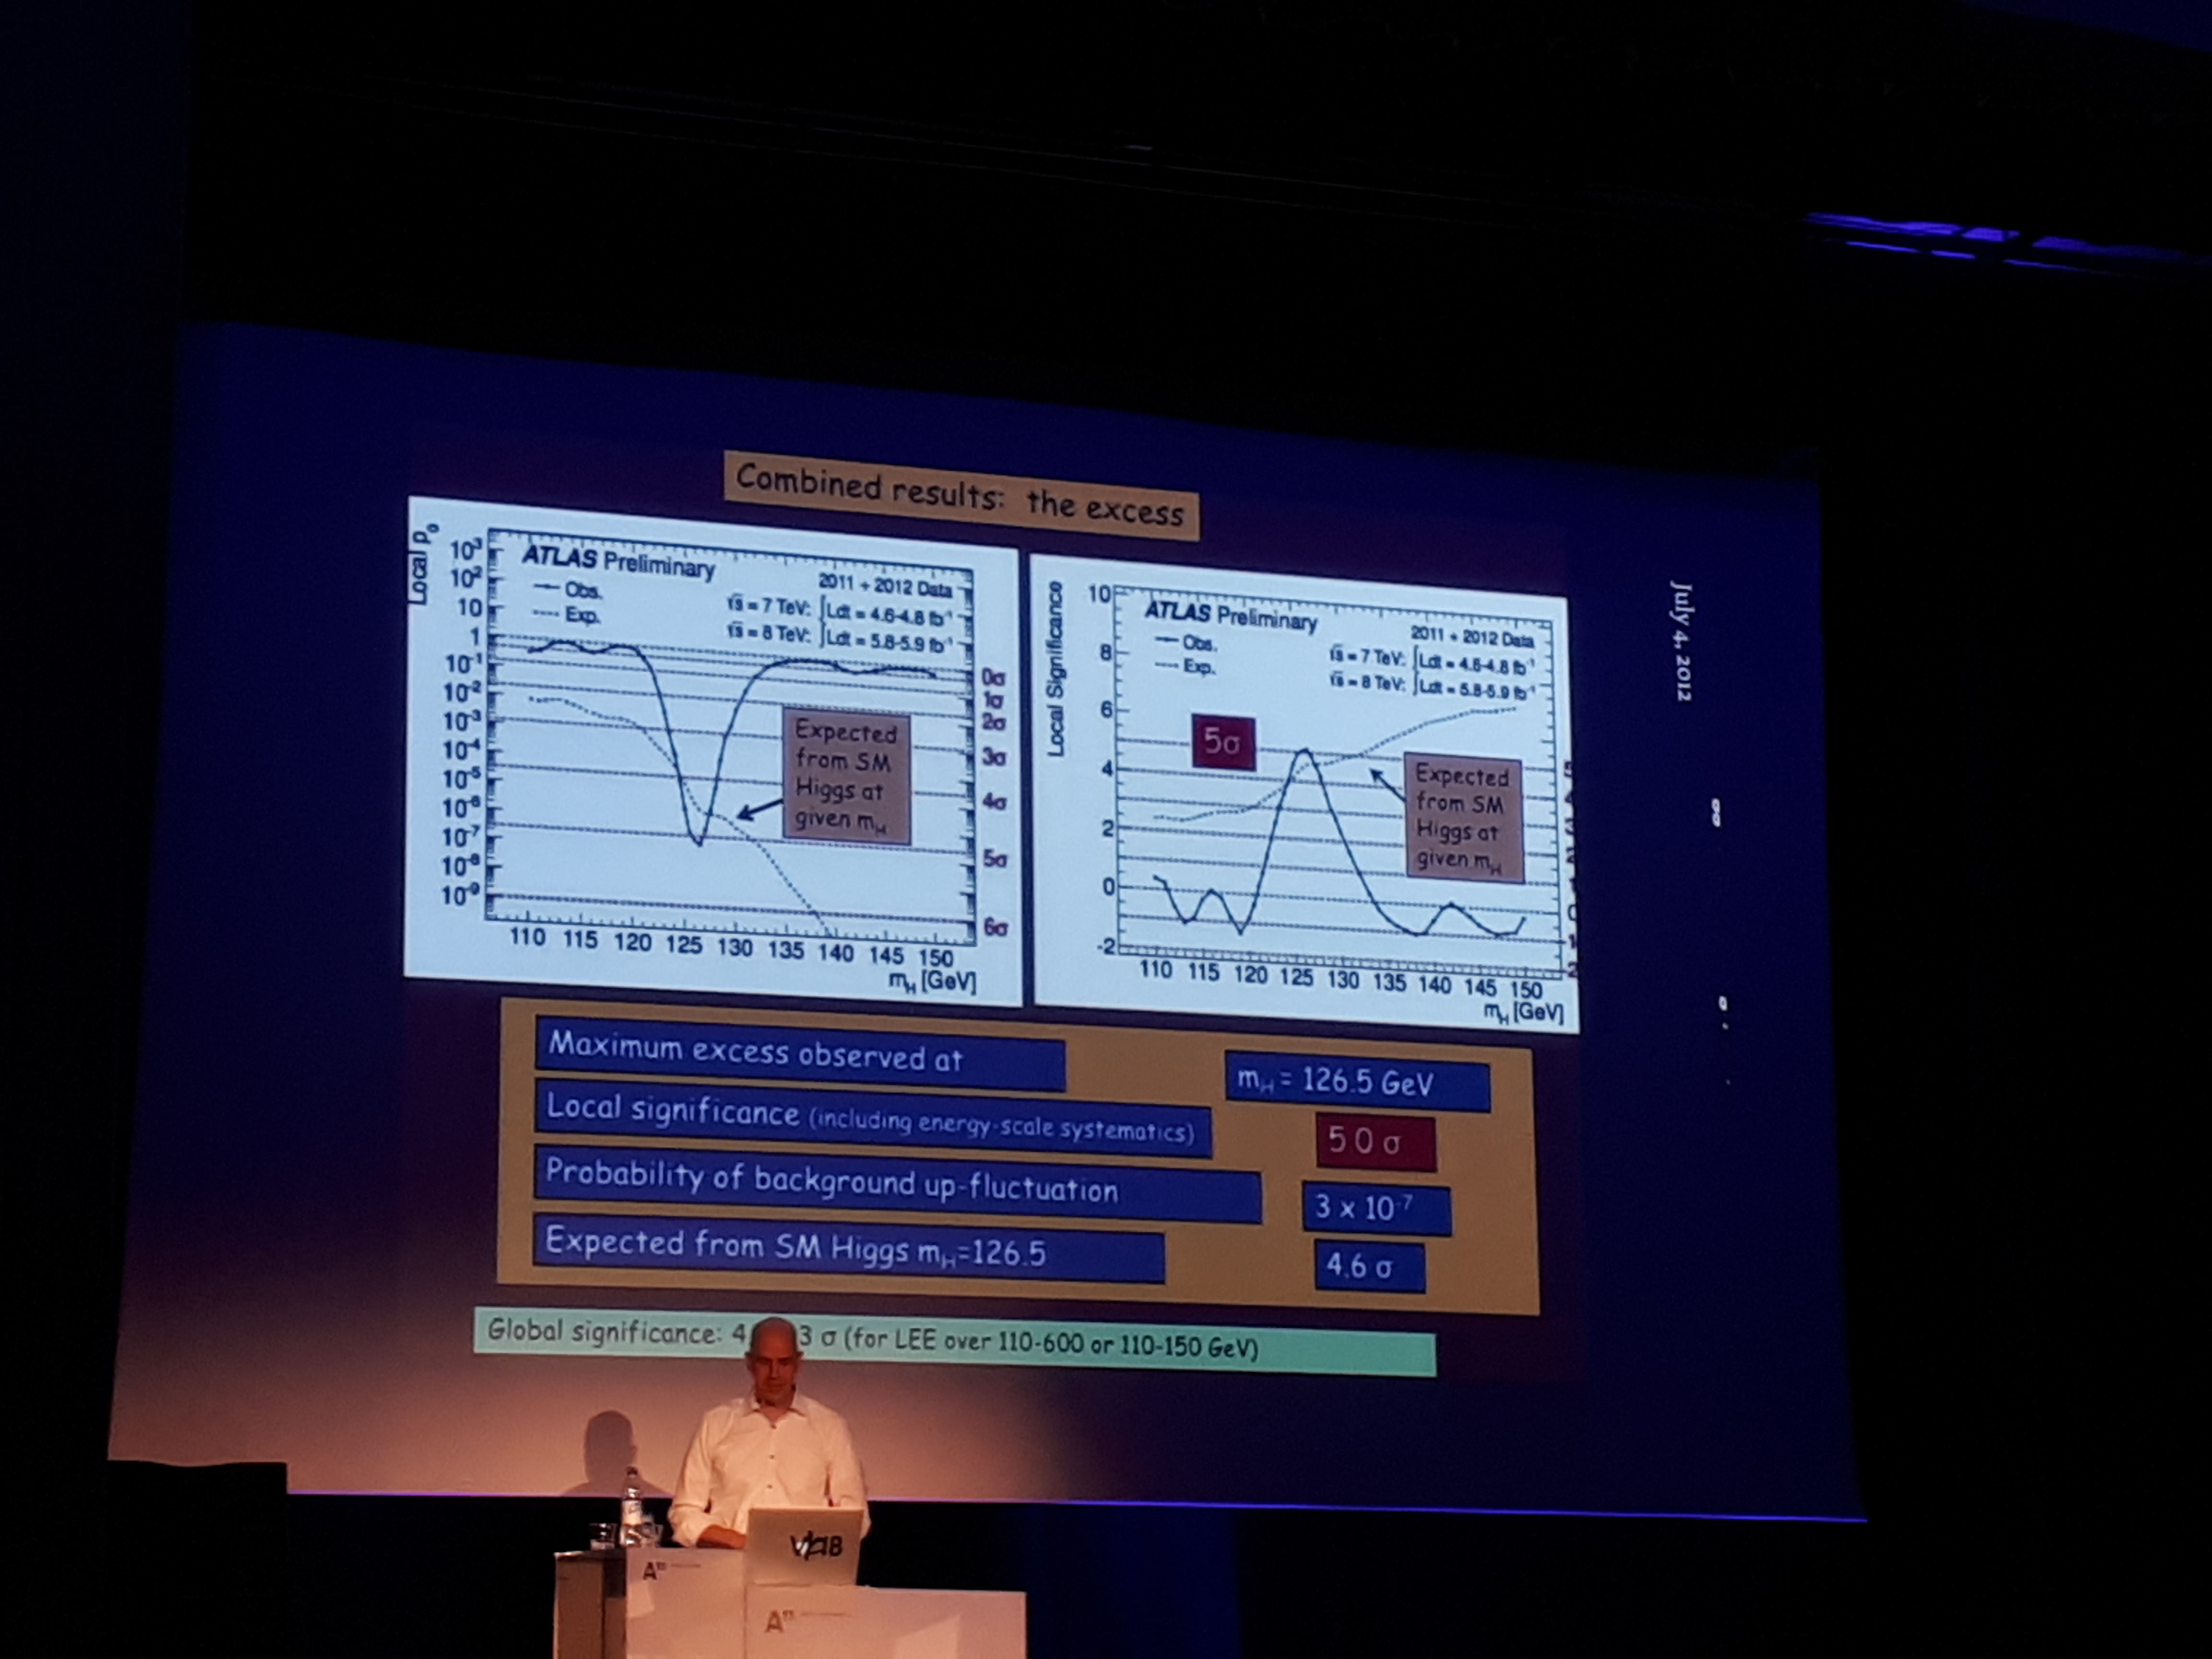
Fidel Thomet and Boris Müller, Urban Complexity Lab
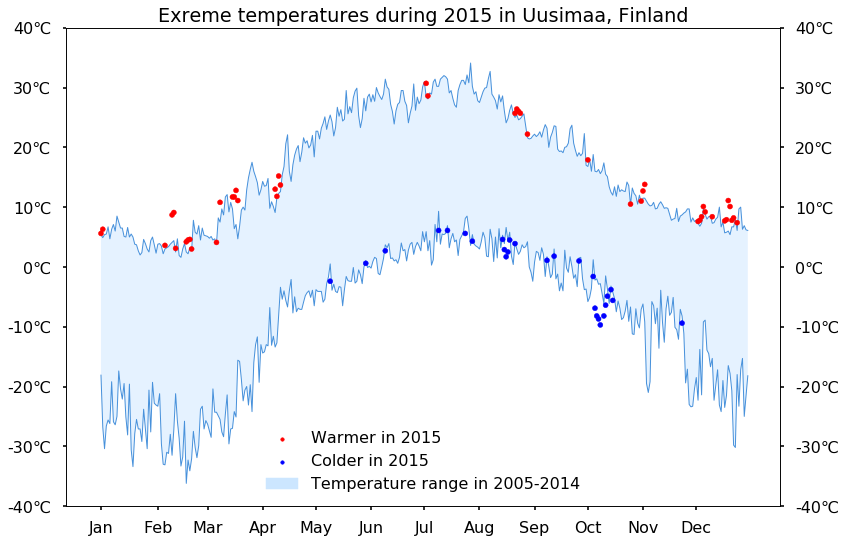
What it should be instead...
- Nadieh Brehmer, a.k.a. Visual Cinnamon.
- Map visualizations by Topi Tjukanov.
- Inside Einstein's head by Lucify.
Dataviz example 1
Dataviz example 2
Summary
Data Analytics : Detection of patterns andmaking better decisions based on it.- Subset of umbrella term "Data Science".
- In many industry cases
"Machine Learning" = "Predictive Modelling" . Data Visualization is an instrument thathelps us think and formulate hypotheses.